Usage Statistics
The Usage Statistics module is one of the fundamental features of the Large Model Service Platform. It helps users gain a comprehensive understanding of resource consumption during model invocation.
This module consolidates multi-dimensional data—such as total calls and input/output token counts—and supports cost analysis, resource optimization, and business decision-making.
Its core value includes:
- Cost Management: Accurately tracks usage (in thousands of tokens). Combined with the platform’s billing rules, it helps users estimate and control costs to avoid resource waste.
- Business Analysis: Leverages trend charts and model distribution to gain insights into usage patterns across different scenarios, optimizing model selection and business workflows.
- Resource Optimization: Identifies high-frequency, high-consumption models to allocate resources appropriately and improve overall platform efficiency.
How to Use
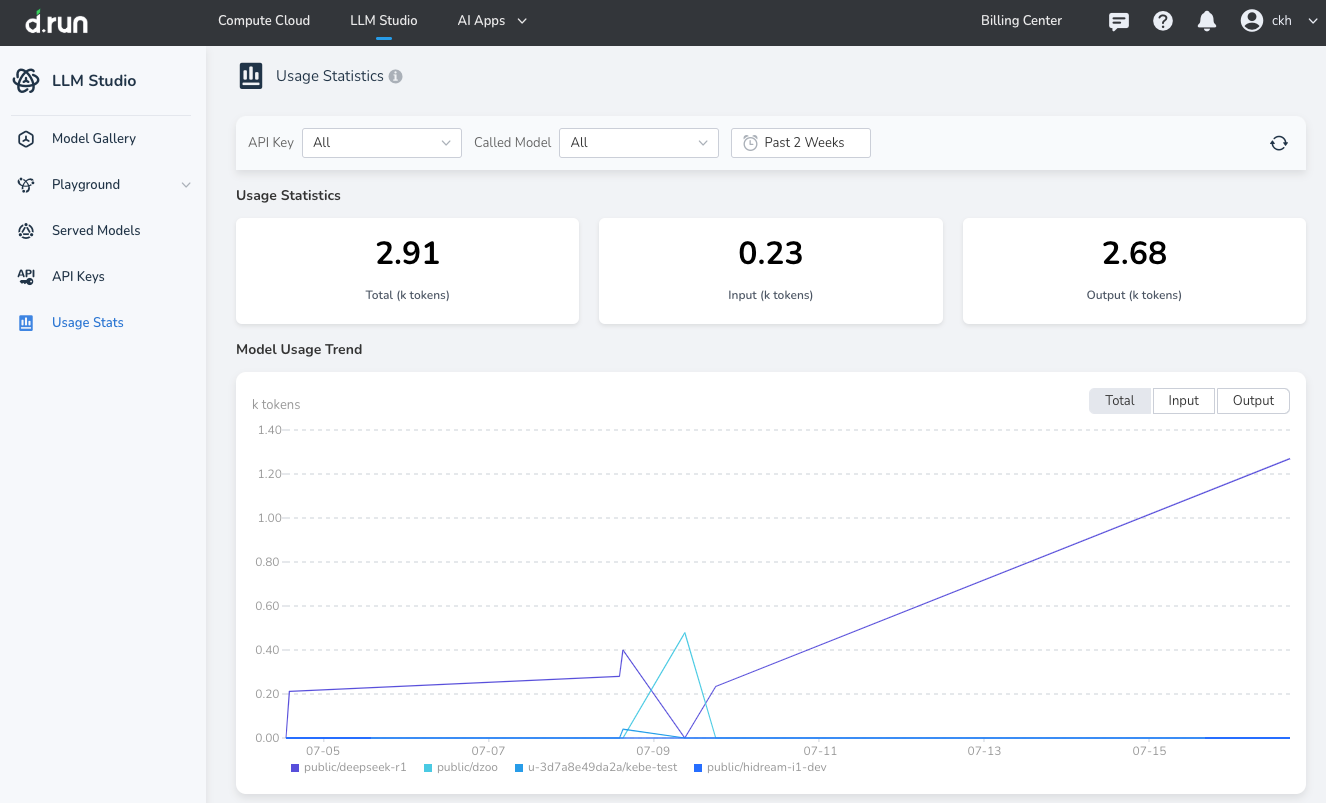
After logging into the platform, click Usage Statistics in the left navigation bar to access the main dashboard for data queries and analysis.
Set Filter Conditions
- API Key Filter: Click the “API Key” dropdown to select a specific key or “All” to view the corresponding usage data.
- Model Filter: Use the “Model” dropdown to select a specific model (e.g.,
public/deepseek-r1) or “All” to focus analysis on your target model. - Time Range Filter: Click the time selector (default is “Last 2 weeks”) to customize the time range (single or multiple days) according to your needs.
View and Interpret Data
-
Usage Overview: The top of the page displays three key indicators:
- Total Usage (K tokens)
- Input Tokens (K tokens)
- Output Tokens (K tokens)
Quickly understand the overall resource consumption.
-
Trend Chart Analysis: The line chart below shows the usage trends of different models over the selected time period. Each model is color-coded, e.g.,
public/deepseek-r1appears in purple.
You can switch between "Total", "Input", and "Output" views to analyze usage trends and business fluctuations.
Refresh Data
Click the refresh icon in the upper-right corner of the page to retrieve the latest usage data and ensure real-time accuracy.
Use Case Examples
-
Cost Accounting
Finance personnel can select “All API Keys” and set the current month as the time range at month-end. By checking total usage and combining it with per-token pricing, they can calculate usage costs and generate expense reports.
-
Business Diagnostics and Optimization
When a business line experiences slow responses, analysts can filter by relevant API Keys and models to review usage trends. If a usage spike is found along with degraded model performance, they can adjust the model or invocation strategy promptly.
-
Operations and Resource Planning
Operations staff can regularly (e.g., weekly) monitor each model's usage and trend changes to identify potential bottlenecks:
- Scale up high-frequency models in advance to ensure service availability.
- Reduce resources for low-frequency models to improve overall efficiency.